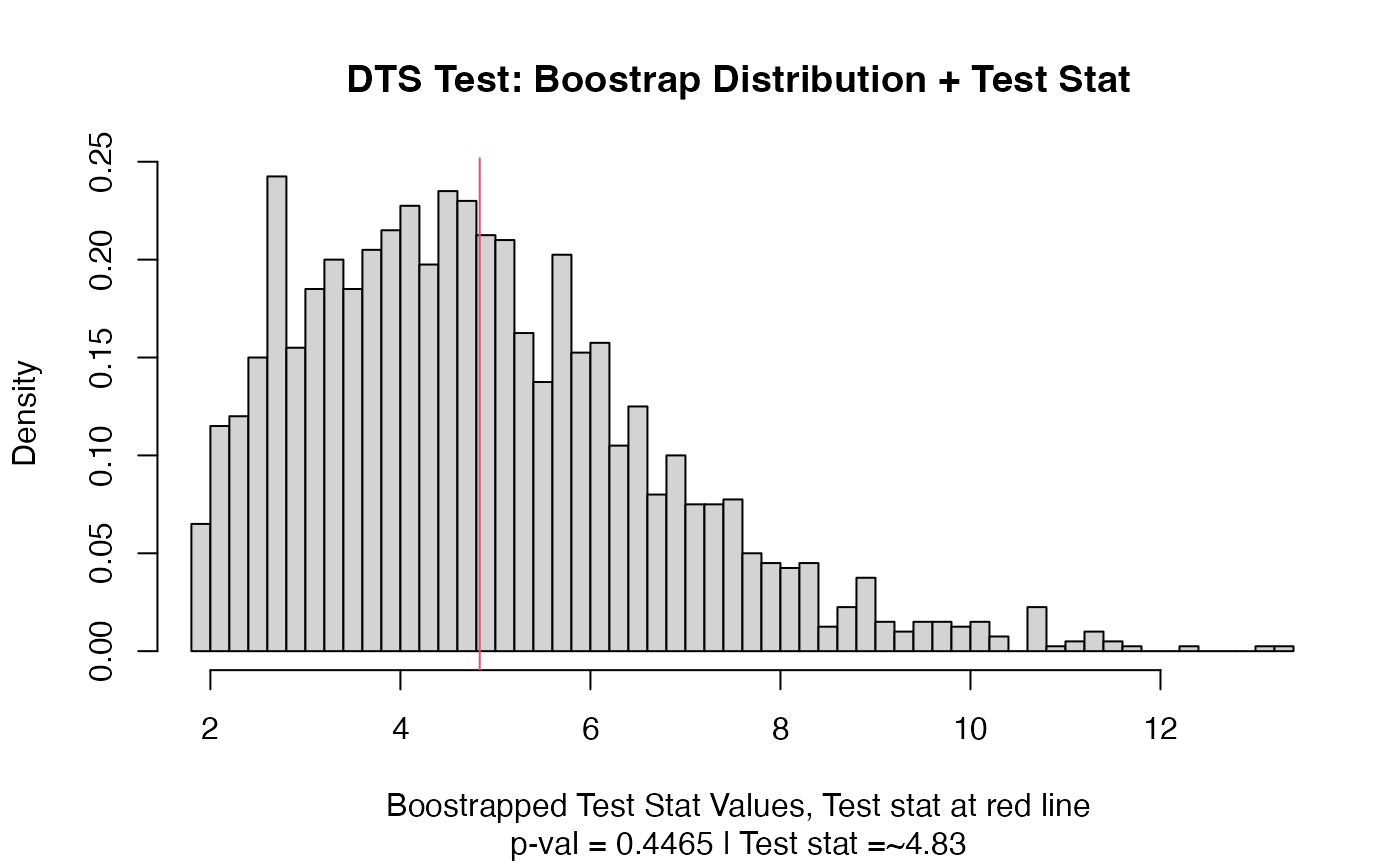
Typically for now this will produce a histogram of the null distribution based on the bootstrapped values, with a vertical line marking the value of the test statistic.
Arguments
- x
an object produced by one of the twosamples
*_testfunctions- plot_type
which plot to create? only current option is "boots_hist",
- nbins
how many bins (or breaks) in the histogram
- ...
other parameters to be passed to plotting functions